Introduction to the ETM
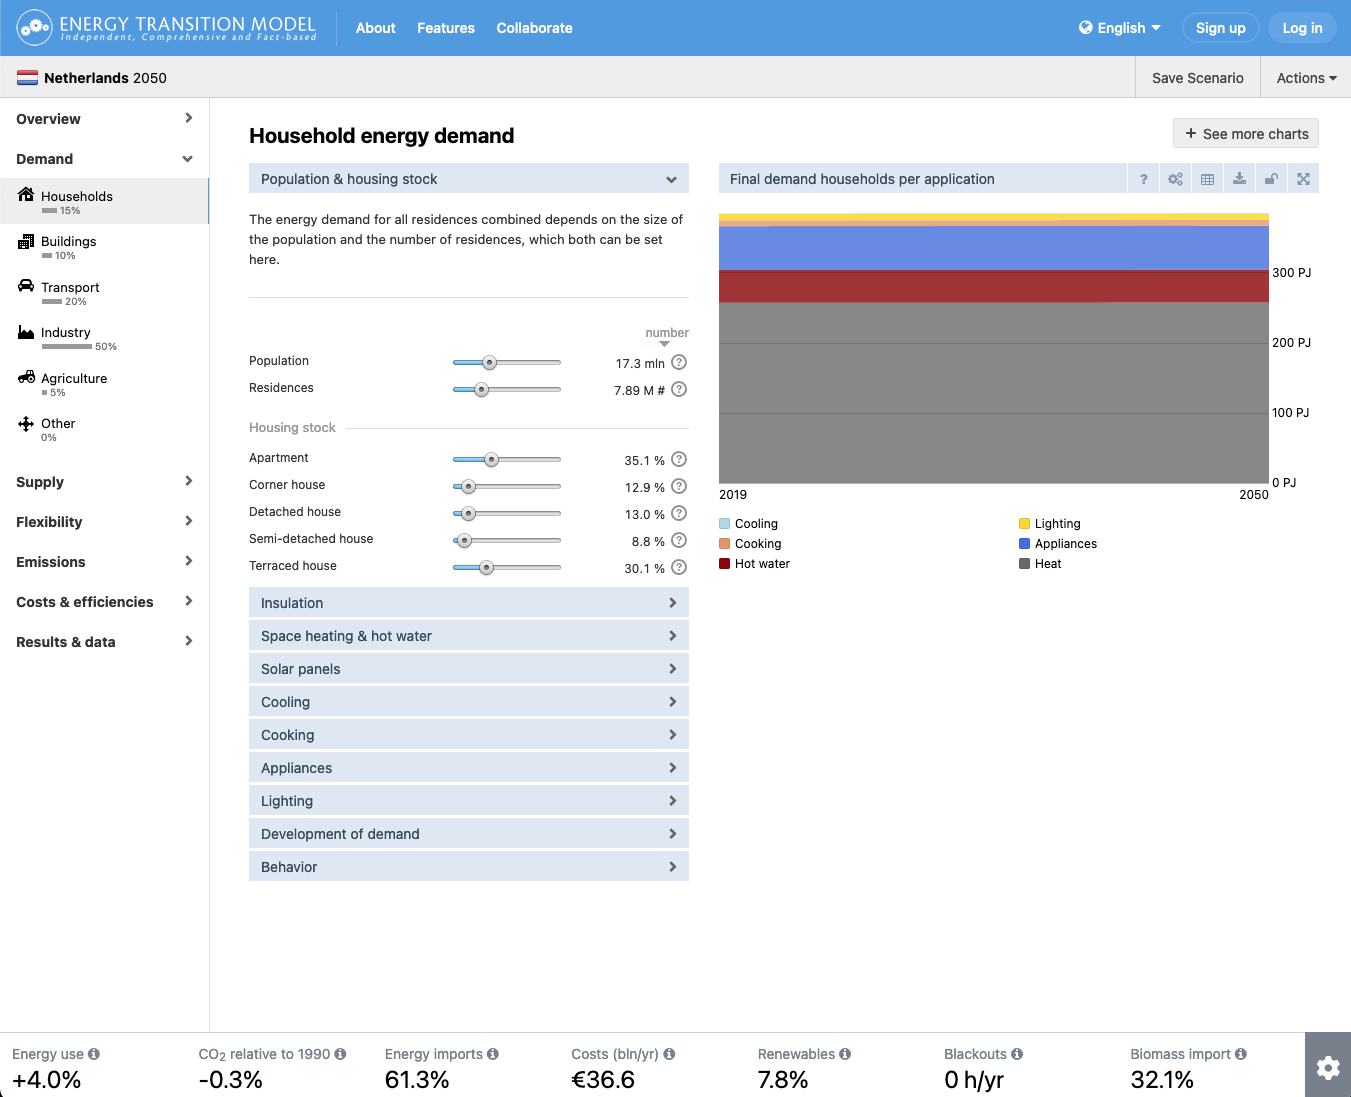
All models are wrong, but some are useful... — George Box (1978) The 2016 Paris Climate Agreement means countries are making plans to reduce their greenhouse gas emissions. In those plans, emissions from energy use play a big role. The transition of the energy system can take different directions, while many options affect each other. The Energy Transition Model was developed to improve everyone's understanding of the energy system in order to make more substantiated plans. The ETM is easy to use. The menu on the left displays all sectors that use energy (Demand) and that produce energy (Supply). For each sector you can use sliders to indicate what you think (or hope) the future will be like. The ETM will then immediately show you the impact of your choices: on the right, charts are shown with specific information. At the bottom of your screen, indicators show the impact on the entire system (e.g. CO2 reduction, energy savings, costs etc.). Advanced users can use the Flexibility section to match demand and supply and the Costs section for costs assumptions. The ETM contains no hidden assumptions, like price or technology developments over time etc. You are in the driver's seat. If you do nothing, the future will not change.
Getting started
Create a future energy scenario by taking these steps:- 1. Go to Professional ETM
- 2. Choose a region and end year for your scenario
- 3. Start exploring by adjusting the sliders
The ETM offers many options for in-depth analysis. Do not let the large number of sliders put you off. Just pick the section that interests you the most.
Open source
The ETM is fully open source:
- The code, modeling logic and data are documented on our documentation website
- Our data sources can be found in our Library
- ETM Dataset Manager and ETDataset contain documentations of the datasets
Interfaces
All calculations of the ETM are done by the same engine. The following applications use this engine:
-
Professional ETM
Our most popular and extensive tool -
The Energy Game
Aimed at primary school children -
Mobile Game
A fun introduction to the most important energy themes